

Reports & Artifacts
Every test run produces a full report: pass/fail per step, screenshots, a video recording, console output, and visual-matching diagnostics. Reports are where you go from "the test failed" to "here's exactly what broke and where".
The reports list
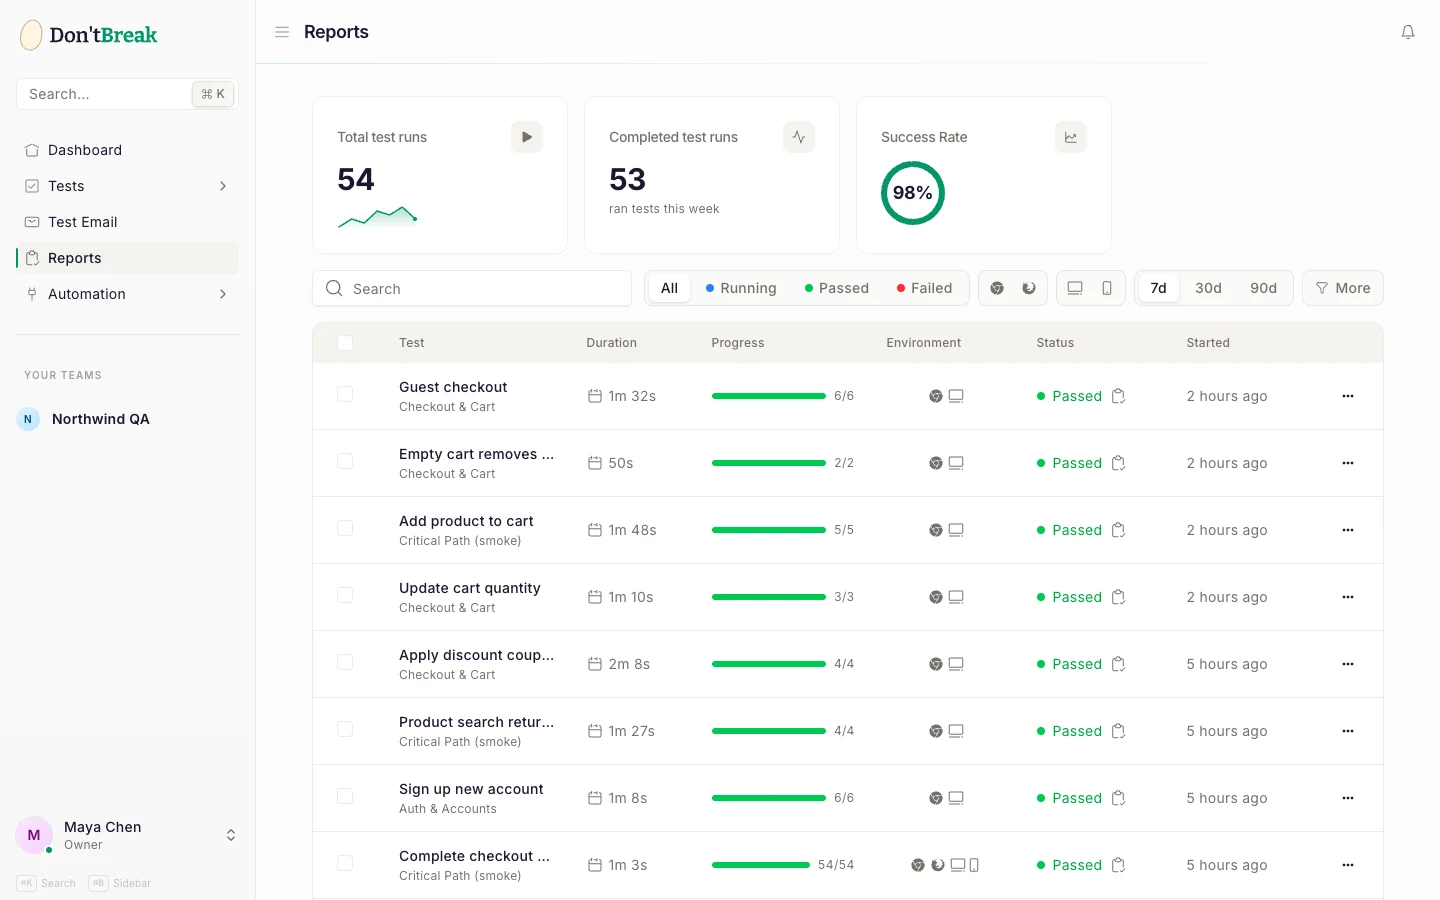
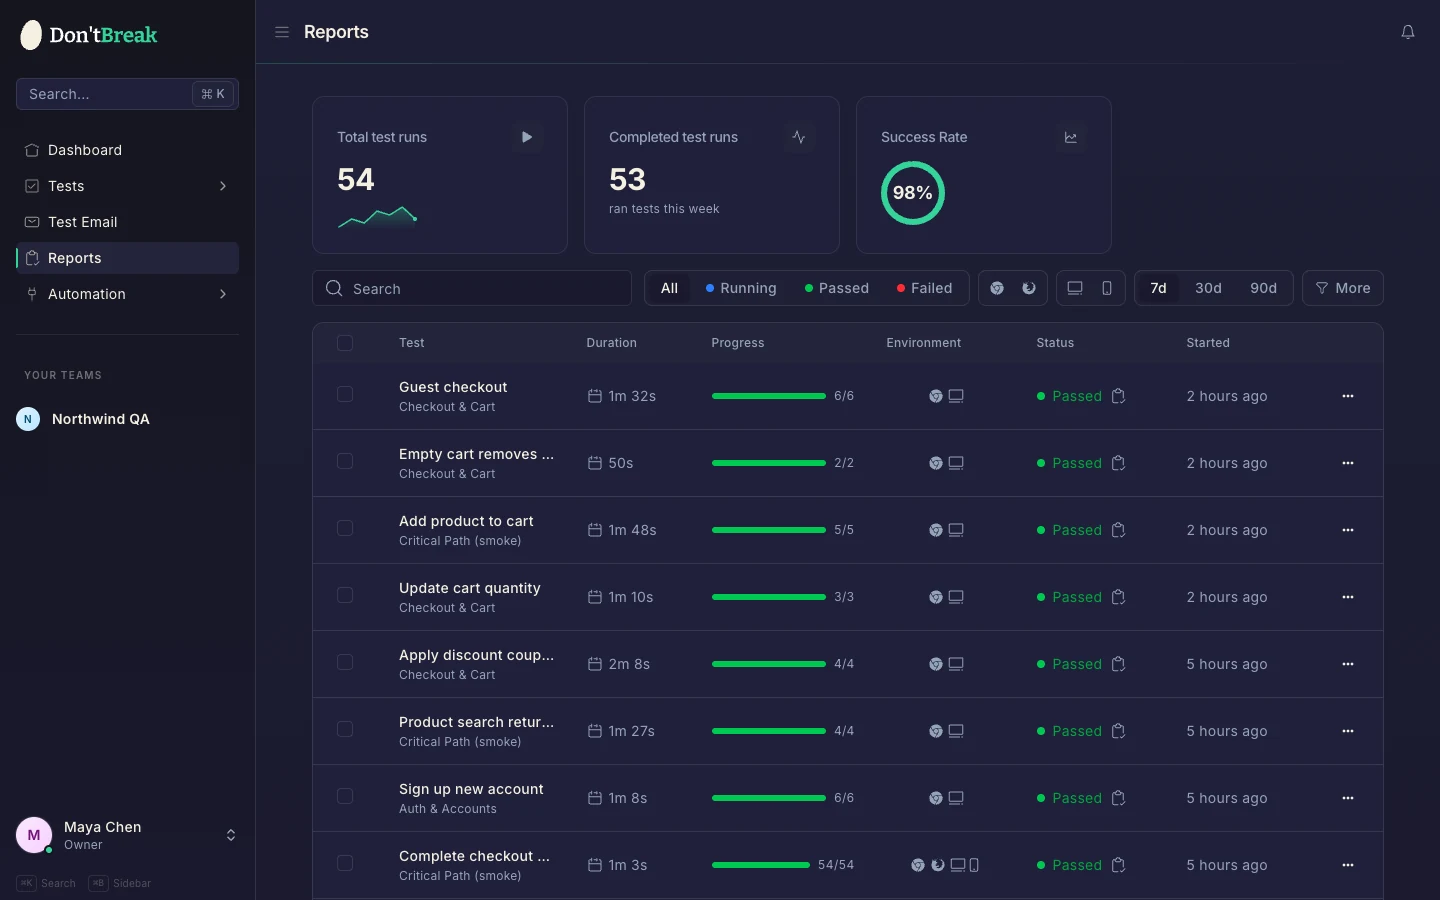
Open Reports in the sidebar for the history of all runs across your team. Stat cards summarize total runs, completed runs, and overall success rate, and you can filter by suite, status, browser, device, and time period.
Rows support bulk selection: select multiple runs to re-run them or delete them in one action. Bulk delete is destructive, so DontBreak asks for your account password before removing anything.
How long reports are kept
Run history is retained for your plan's window — 14 days on Solo, 30 days on Team, 90 days on Agency. Older runs and their artifacts (screenshots, videos, logs) are pruned automatically. If your subscription is canceled or lapses, retention drops to a 7-day floor. Use Export to keep a PDF or JSON copy of anything you need long-term. See Plans & Billing.
Report anatomy
Click any run to open its report.
Stat cards
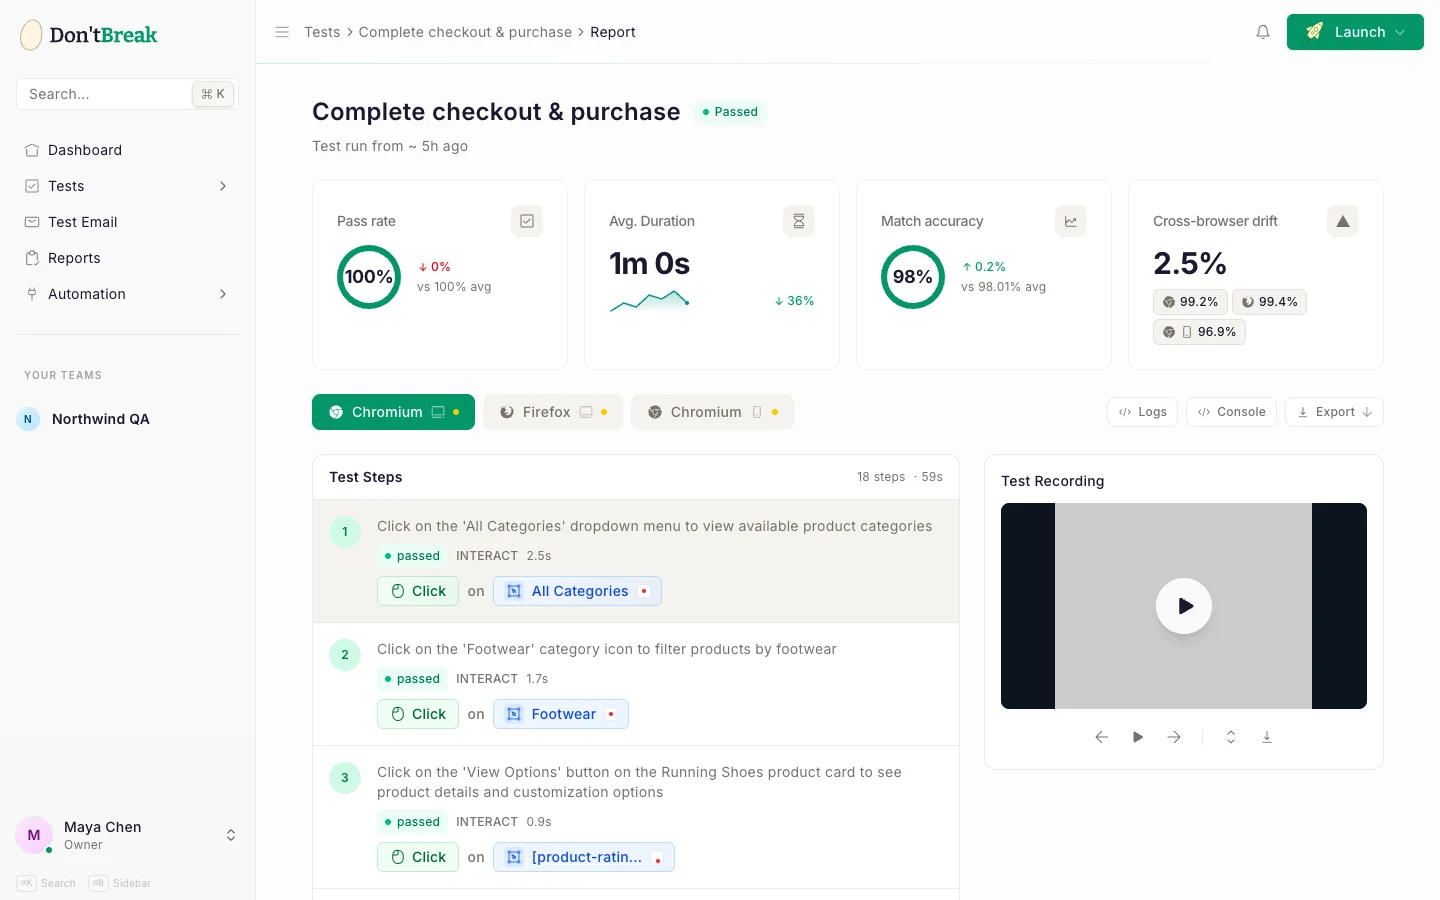
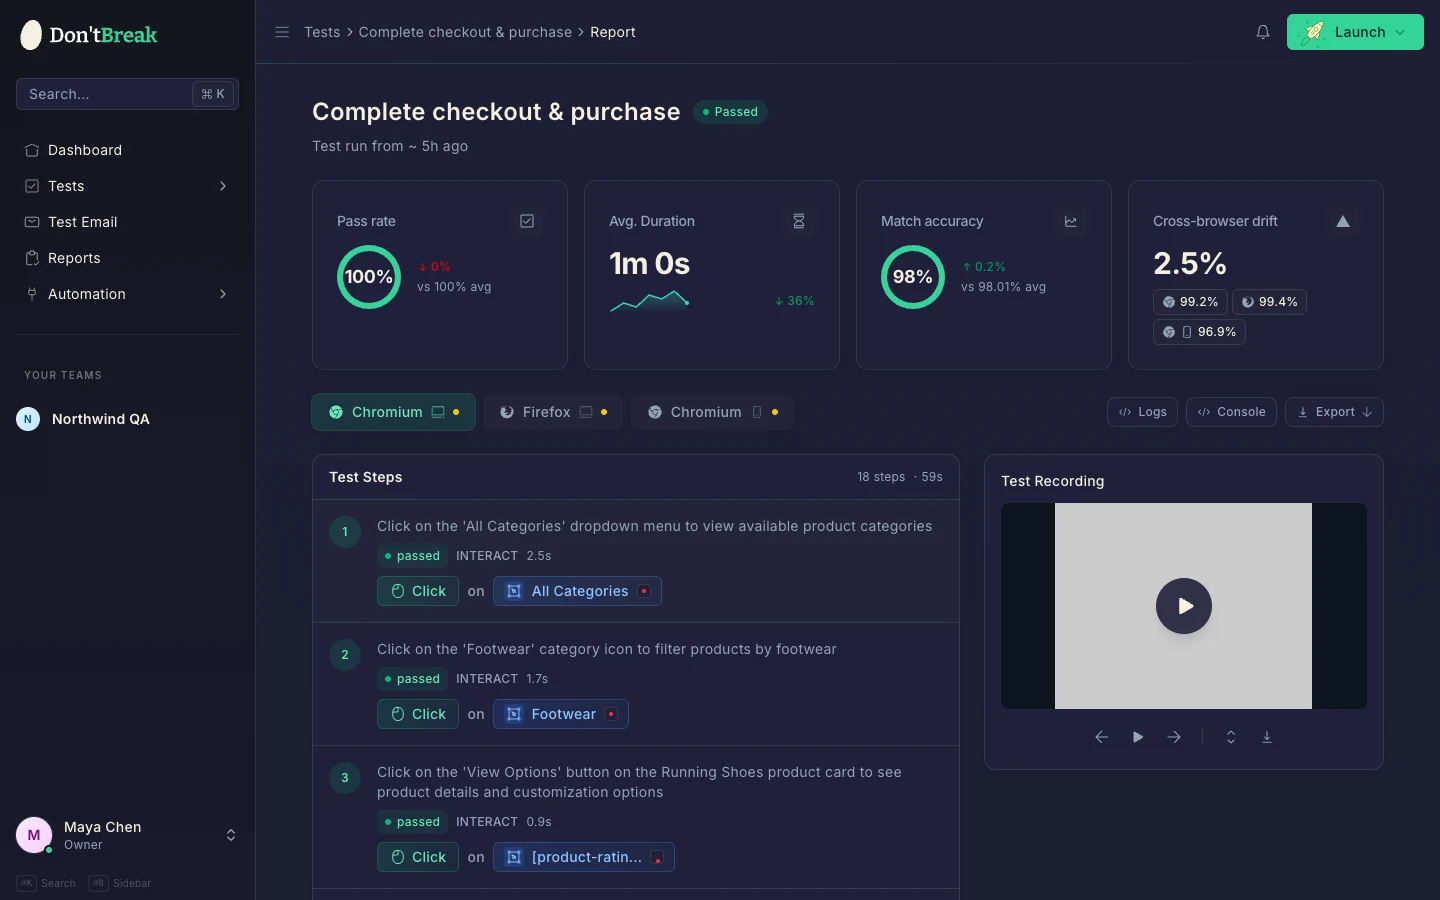
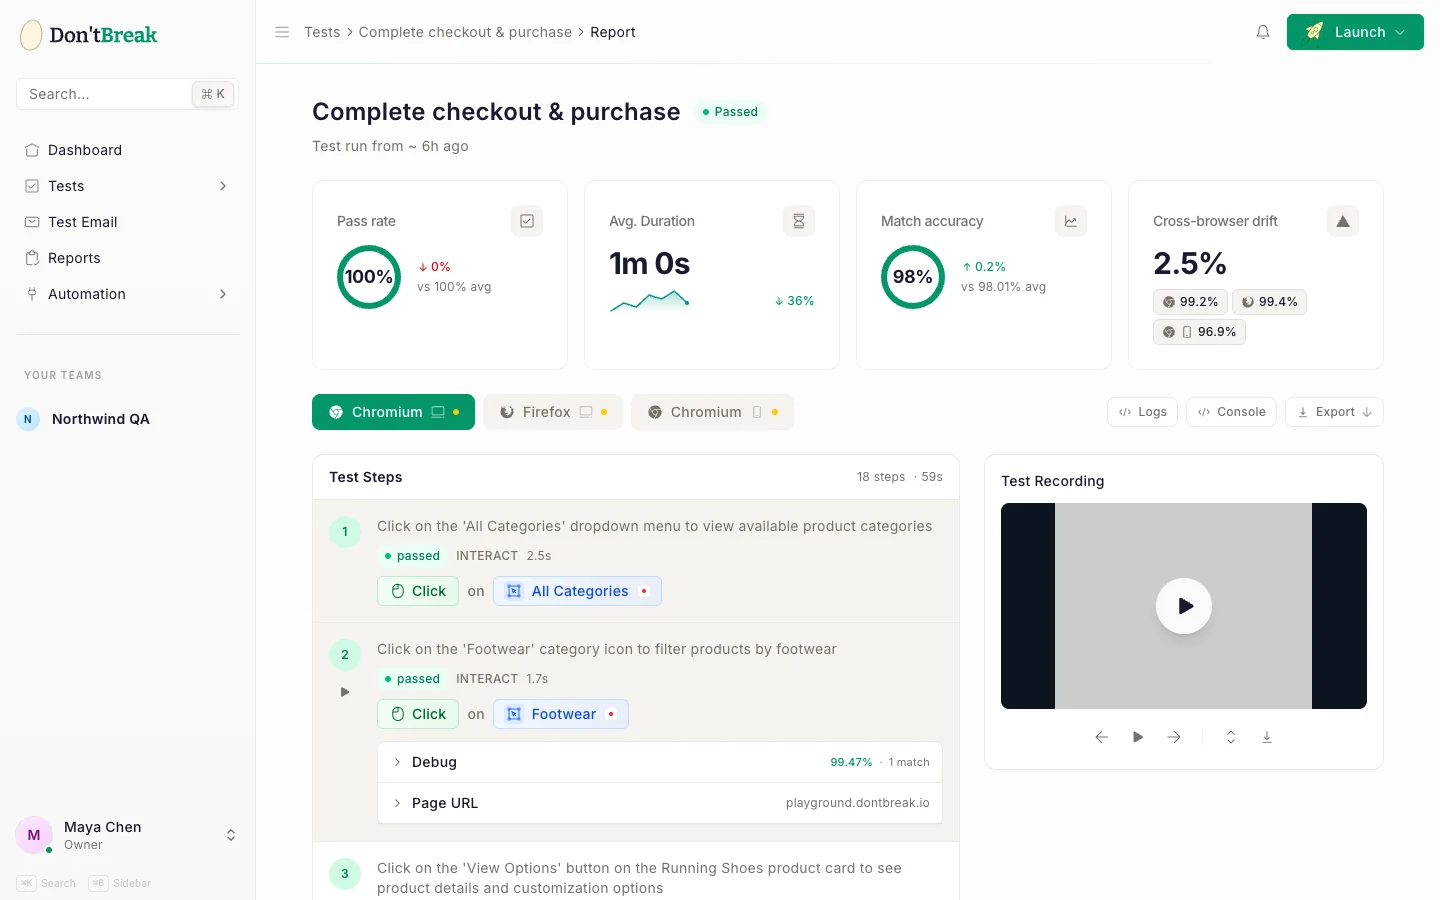
- Pass rate — percentage of steps that passed in this run, compared against the test's historical average.
- Avg. Duration — how long the run took, with the change versus previous runs. A sudden jump often means your site got slower.
- Match accuracy — average visual-matching confidence across all steps, with a per-browser breakdown. See below for what this means.
- Cross-browser drift — shown when the run covered multiple browser/device combinations; it surfaces the largest visual divergence between them, pointing at the worst-drifting step.
Browser and device tabs
Each enabled browser × device combination is its own run with its own steps, screenshots, and video. Switch between them with the tabs (e.g. Chrome Desktop, Firefox Mobile). A warning icon on a tab flags low matching confidence or a feature-match fallback in that run.
Toolbar buttons
| Button | What you get |
|---|---|
| Logs | The test runner's execution logs for this run. |
| Console | The browser's own console output, grouped by step. A red badge appears when errors were captured. |
| Export | Download the report as PDF or JSON, or export the test as Playwright Test / Playwright Script code. |
| Artifacts | Download the run's raw artifacts (screenshots, recordings) as an archive. |
Step-by-step results
The Test Steps list shows every step with its status (passed, failed, or skipped — see Browsers & Devices for why steps get skipped), duration, and screenshot. Expand a step to open its detail view:
- Debug — the visual-matching diagnostics: the matched area thumbnail (click to enlarge), the match score, the matching method used, match coordinates, and a side-by-side diff viewer comparing expected vs actual.
- Page URL — the exact URL the browser was on when the step executed. Invaluable when a redirect sent the test somewhere unexpected.
Match accuracy, explained
DontBreak locates elements visually: it searches the live page for the element image captured when you recorded the step. The match percentage is the confidence of that visual match. High scores mean the page still looks like it did at recording time; falling scores mean the UI has drifted — even if the test still passes.
When an exact visual match isn't found, DontBreak falls back to feature detection. The step detail calls this out explicitly; it's common when a page has several similar-looking elements (e.g. repeated input fields). If the fallback matched the wrong element, re-record that step for more precise targeting. More on this in Handling Dynamic Content.
Test recording video
Each browser/device run includes a Test Recording panel with a video of the entire session. Click a step in the steps list to jump the video to that exact moment — the fastest way to see what actually happened around a failure. You can collapse the video panel when you just want the step list.
Tip
For failures you can't reproduce, watch the video first, then check Console for JavaScript errors and the step's Page URL — together they explain most "works on my machine" mysteries. For visual-match failures that do reproduce, use the Debug diff viewer instead. See Common Errors for typical patterns.