

Understanding Test Results
Every test run in DontBreak produces a detailed report: per-step results with screenshots, a full video recording, console logs, and history stats like success rate and average duration. This page explains how to read a report so you can tell in seconds whether a failure is a real bug, a flaky step, or a change on your site.
Test statuses
In the tests list, each test shows one of four statuses:
| Status | Meaning |
|---|---|
| Draft | Created but not yet run (new tests start here) |
| Running | A run is currently executing |
| Passed | The latest run completed with all steps passing |
| Failed | The latest run had at least one failing step |
Each run executes once per enabled browser × device combination (e.g. Chromium Desktop, Firefox Mobile), and the report has a tab for each so you can compare results across browsers and devices.
The report page
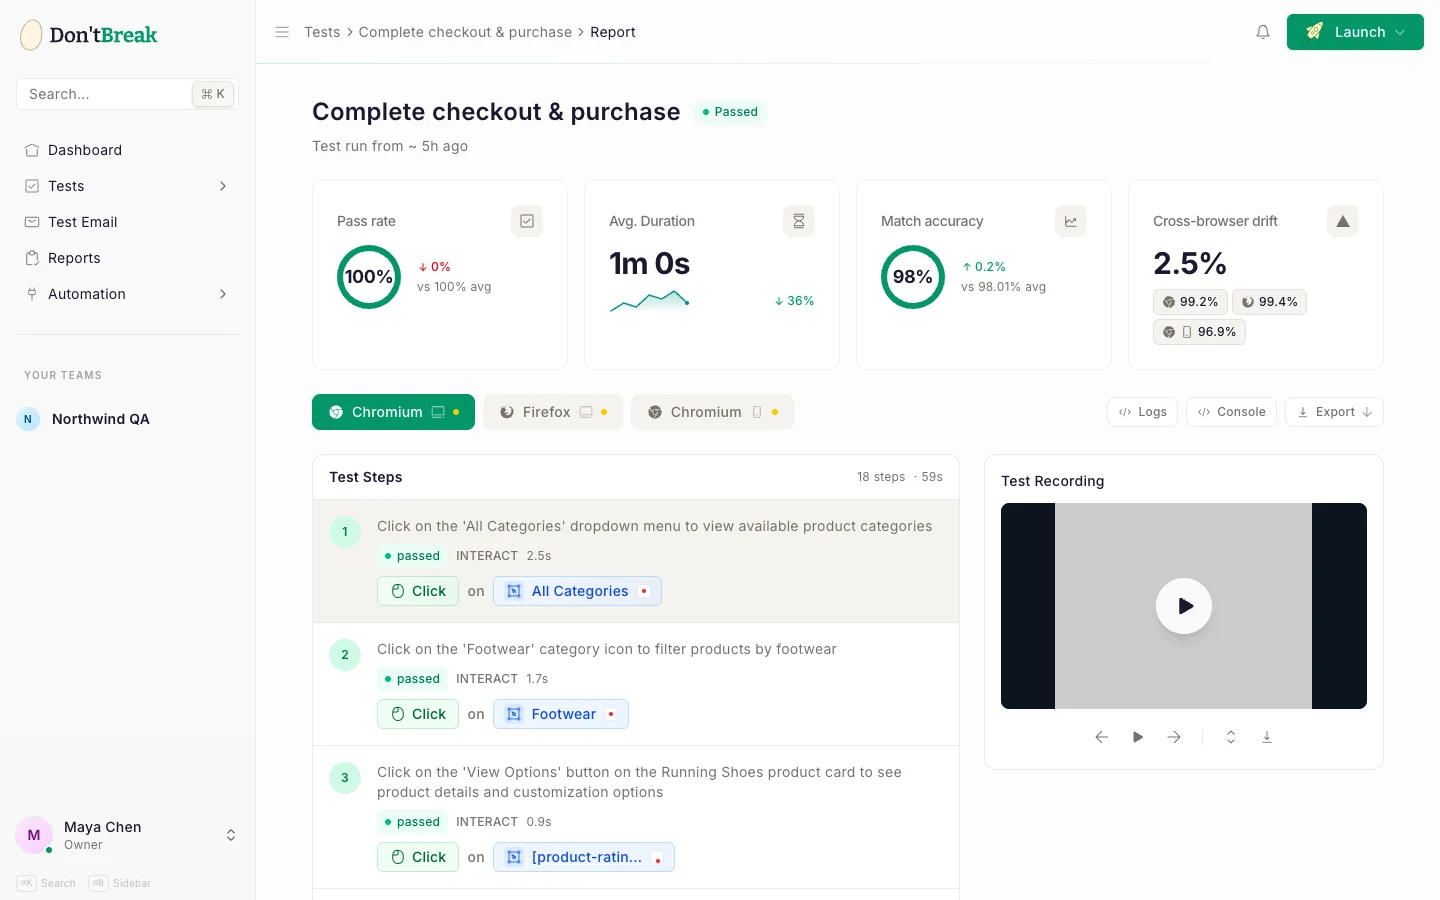
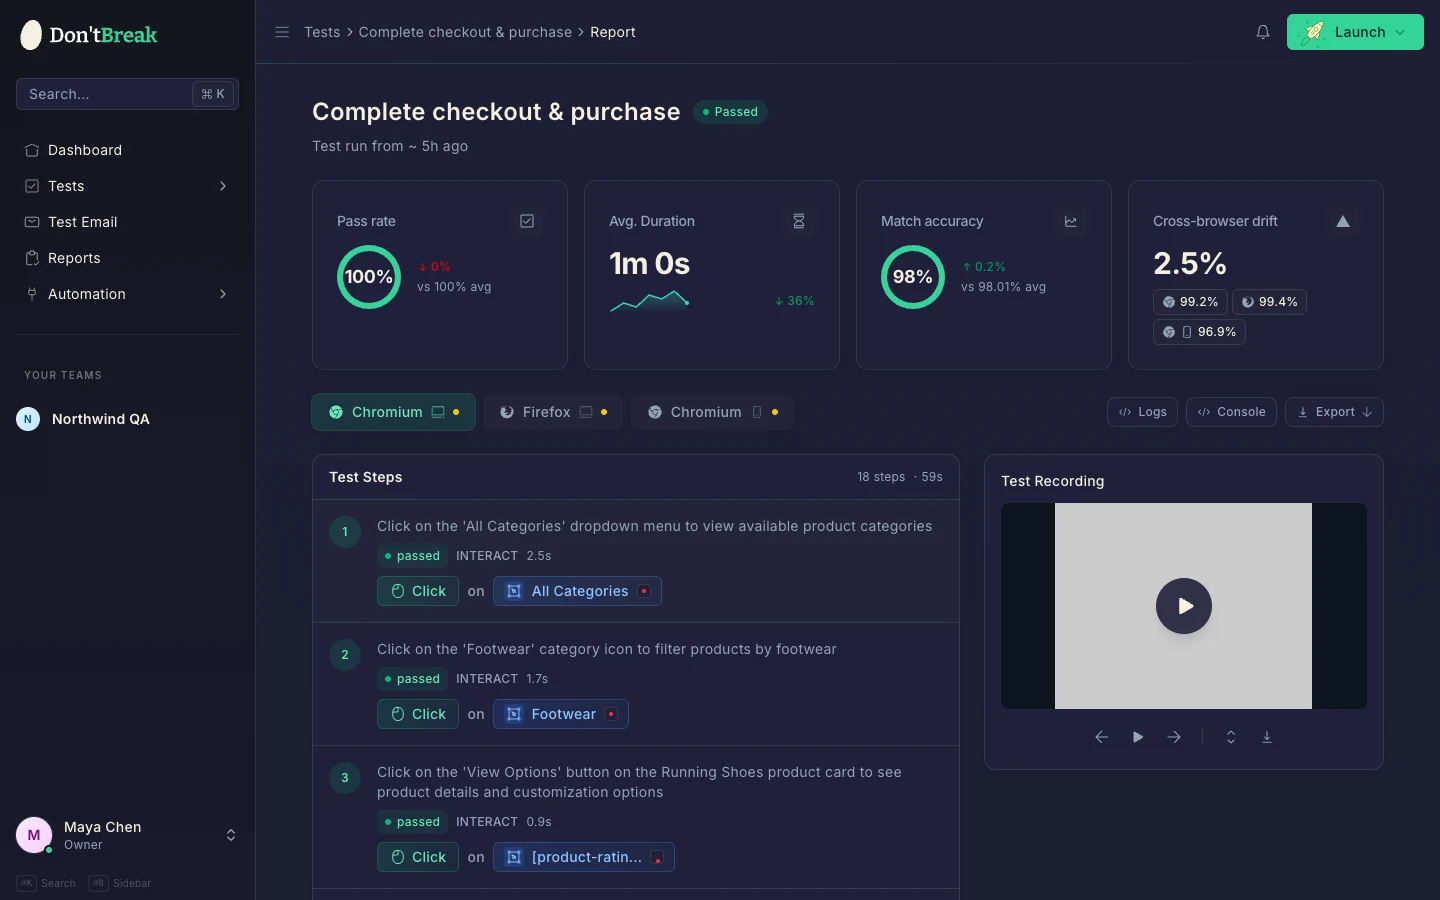
The header gives you four tools:
- Logs — the runner's execution log for this report.
- Console — the browser console output, grouped by step, with an error indicator when something logged an error.
- Export — download the report as PDF or JSON.
- Artifacts — download the run's raw artifacts (screenshots, video, traces).
Step-by-step results
The Test Steps panel lists every step with its pass/fail status, duration, and screenshots. Expand a step to see exactly what happened: the screenshot at that moment, the matched element, and — for failures — what was expected versus what the page actually showed.
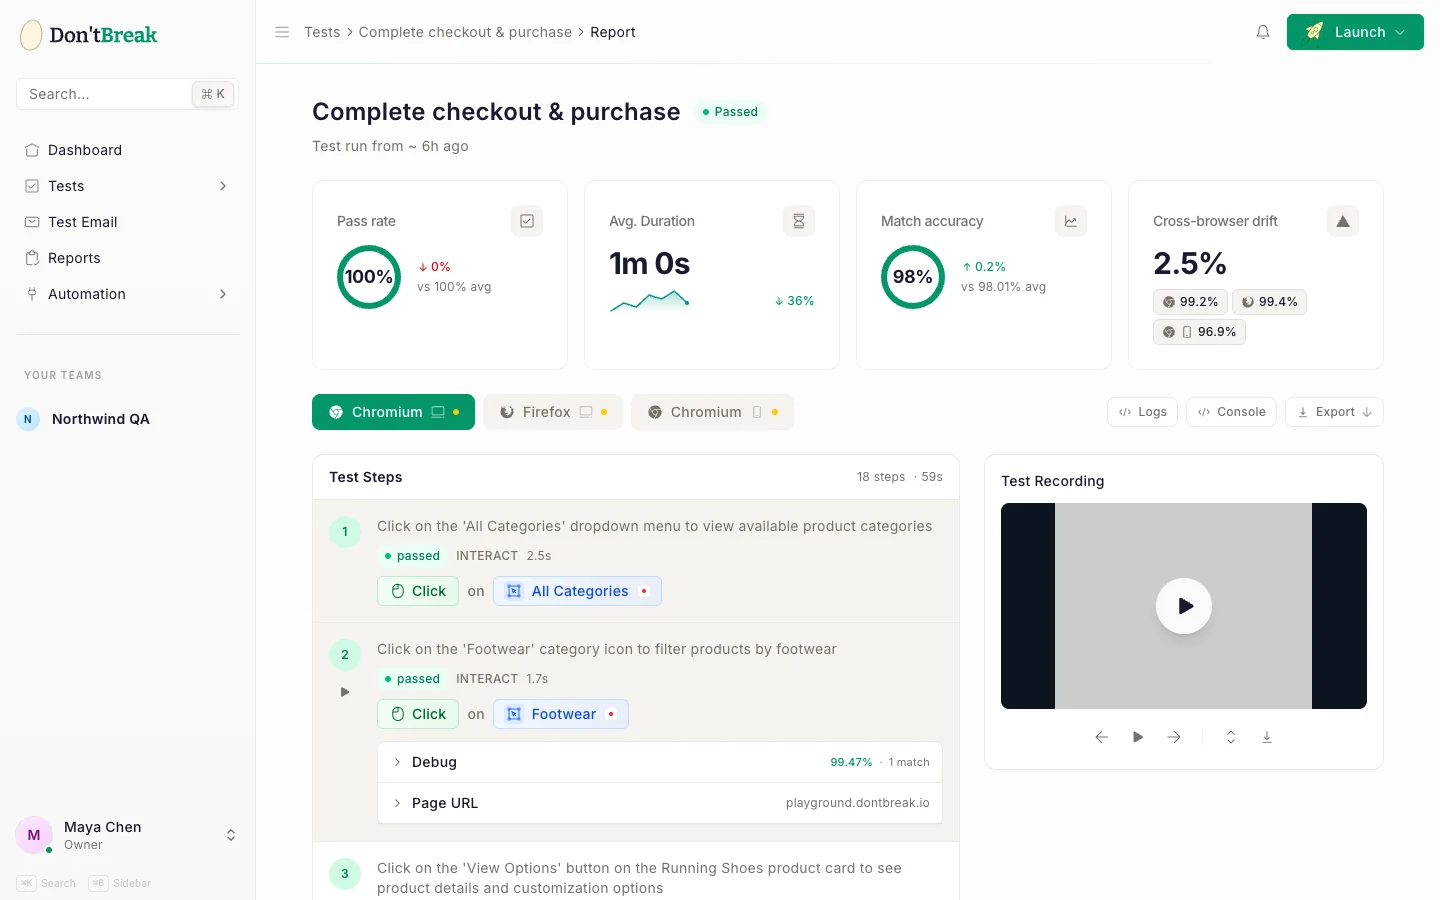
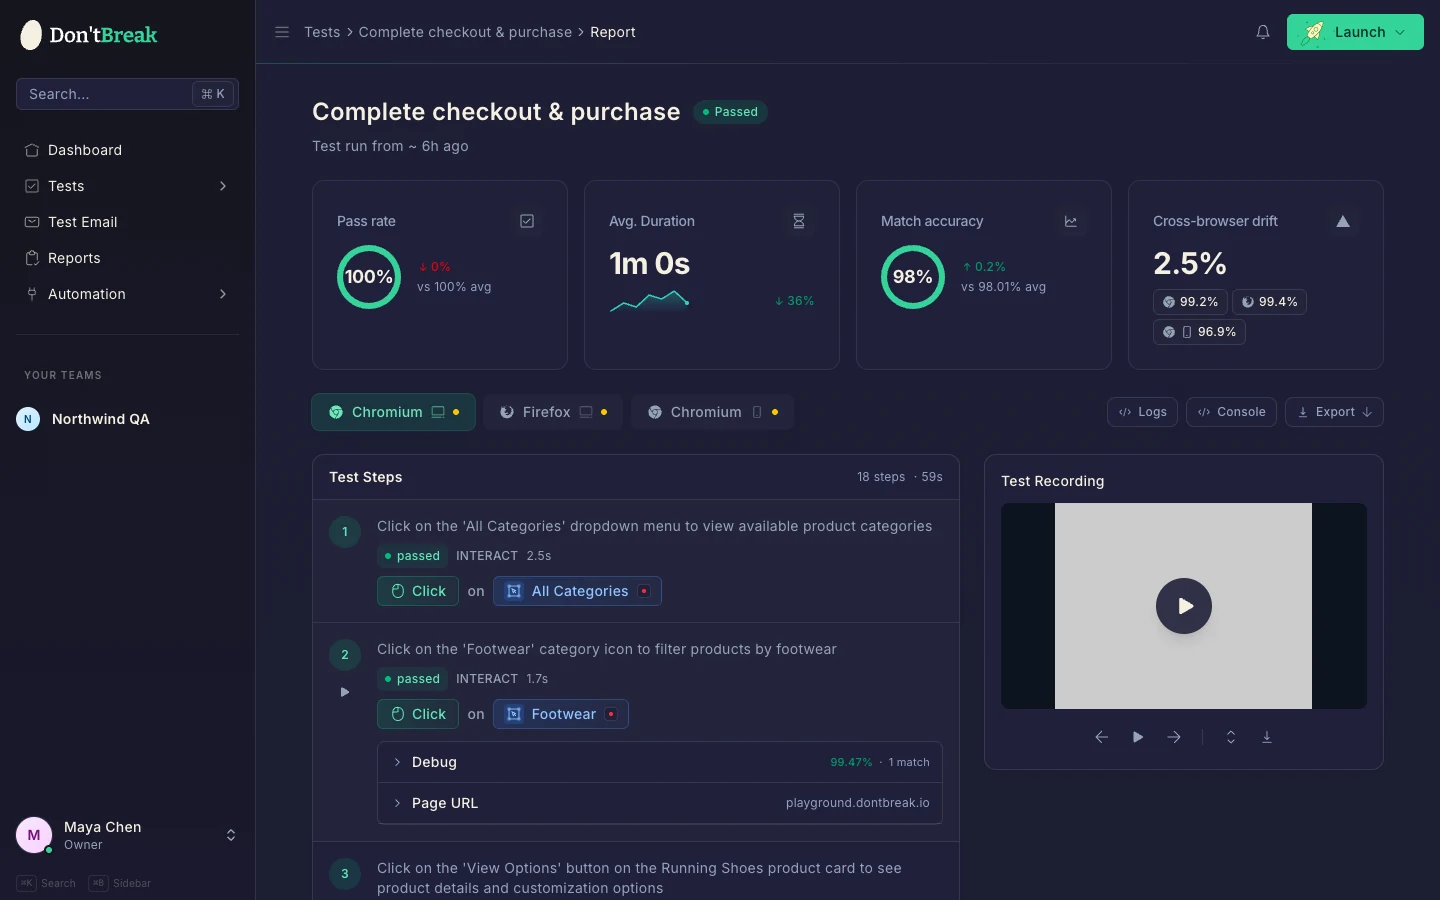
Each step also has a Jump to this step in video button that seeks the recording to the exact moment the step ran — usually the fastest way to understand a failure.
AI Check verdicts
An AI Check step shows a verdict chip instead of a plain pass/fail: Yes or No with the model's confidence percentage, Needs review for a borderline result, or Unavailable if the AI service couldn't be reached during the run. Needs review shows amber and doesn't fail the run on its own — unless the step had Fail if uncertain turned on, in which case it's treated as a failure.
Expand the step's What the AI read panel to see exactly what was sent to the model: the page's visible text and controls at evaluation time. It's the fastest way to tell whether a Needs review result means the question was ambiguous, or the page genuinely hadn't reached the expected state yet.
Video recording
The Test Recording panel plays back the entire run as the browser saw it. Combined with jump-to-step, you can watch the seconds leading up to a failure: was a modal in the way, did the page load slowly, did a banner cover the button?
Match confidence
For steps that target an element, DontBreak finds the element by visual matching — exact pixel matching first, with a feature-detection fallback that's cross-checked against the element's stable DOM identifiers. The step's match details show a confidence percentage — how closely the element found during the run matched the one you captured in the composer — plus the match method used and a thumbnail of the matched area.
High confidence (95%+) means the element looked the same as when you built the test. Lower confidence, or a fallback match method, gets flagged with a warning on the report tab — the step may have still passed, but the element has visually drifted and the step might be worth re-capturing. See Test reliability for keeping confidence high on dynamic pages.
Comparing the live page against the recorded target
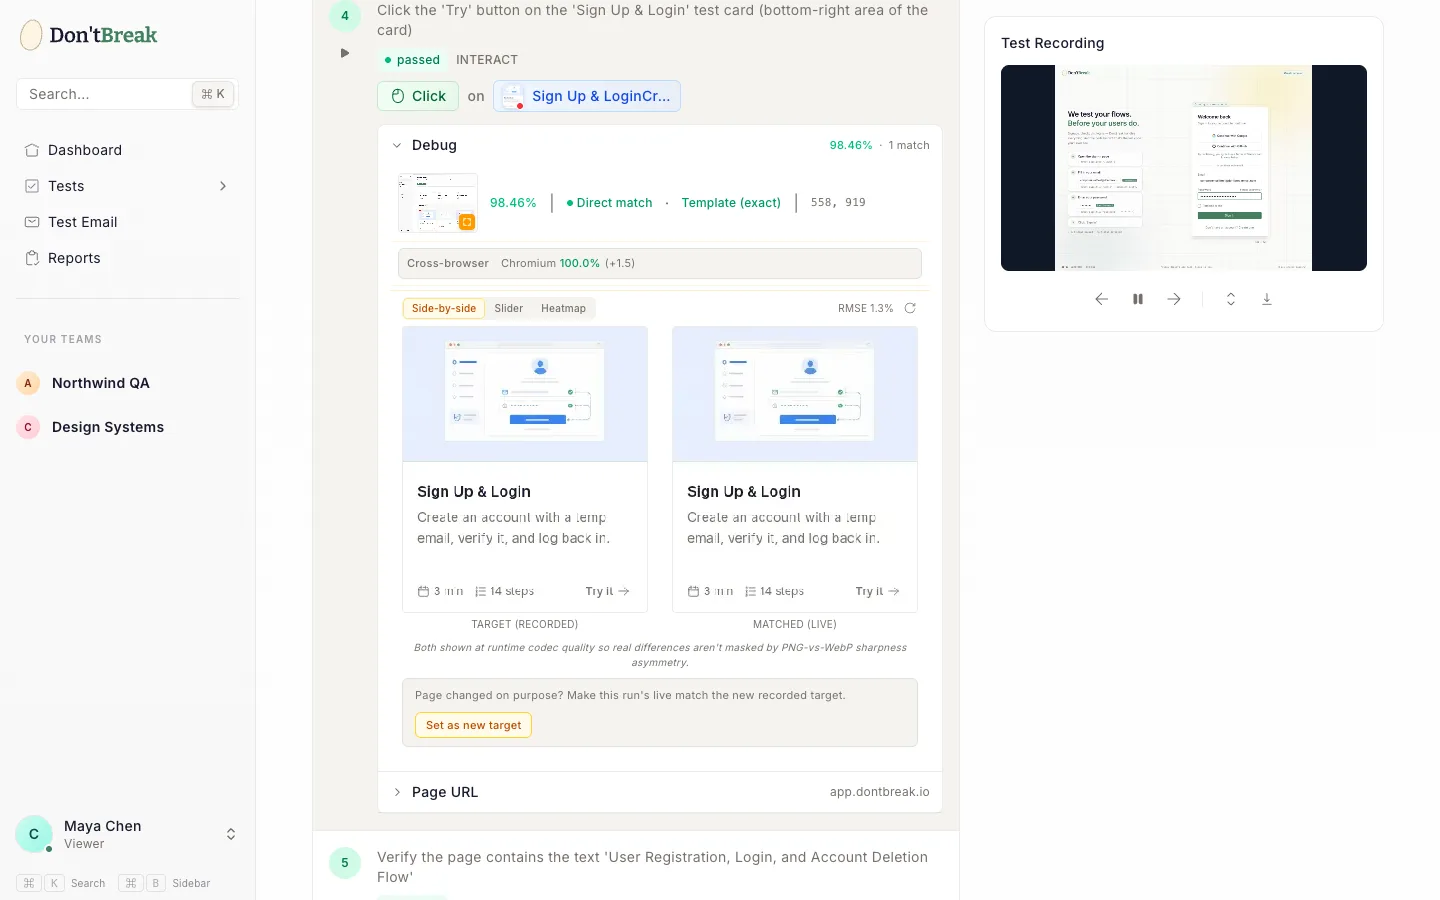
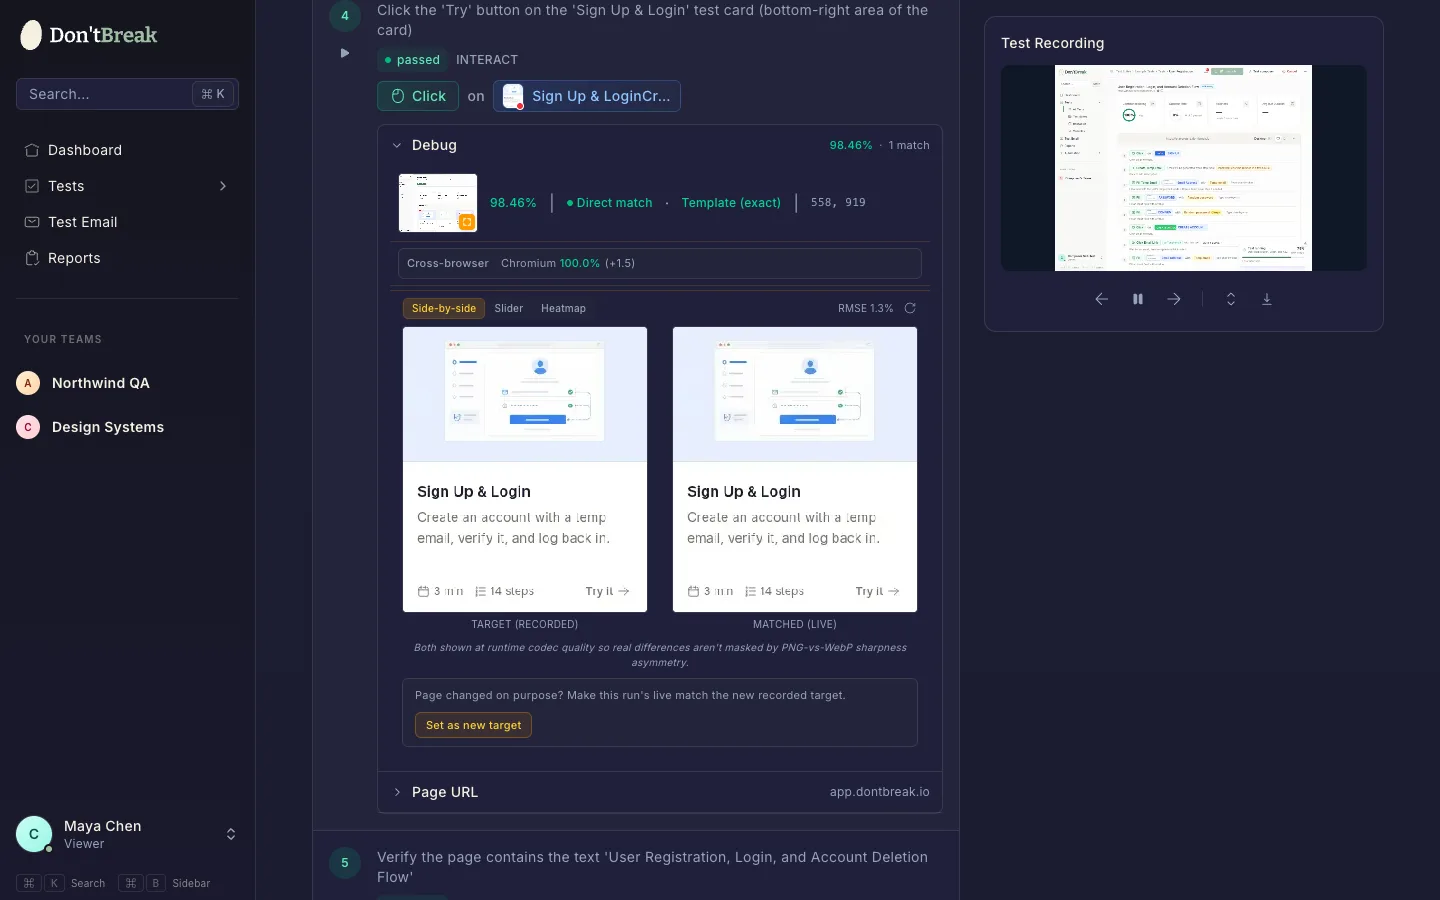
Expand a step's Debug section to see exactly how the live page compared to what you recorded: Side-by-side shows both crops next to each other, Slider overlays them with a draggable divider, and Heatmap highlights the pixels that differ. Both images are shown at the same codec quality, so what you see differing is what actually differed.
Page changed on purpose? Set a new target
When the comparison shows a real difference because you changed your site intentionally — a redesigned button, new copy, a rebrand — you don't need to re-record the step. Click Set as new target below the comparison and this run's live match becomes the step's recorded target. Future runs compare against the page as it looks now, and the previous target is kept as a backup.
A few things to know:
- If the element was found at a different scroll position, the recorded scroll moves with it automatically.
- If the step belongs to a reusable component, the new target applies to every test that uses it — the confirmation dialog tells you how many.
- If the step has an ignore-mask, double-check it still covers the right region after the swap.
- The button is offered on Chromium runs; runs from other browsers don't save the full-quality capture the new target needs.
Test history
Below the run details, the Test History section summarizes recent runs:
- Success Rate — percentage of recent runs that passed.
- Avg Duration — average run time, useful for spotting performance regressions.
- Flakiness — how often results flip between pass and fail without changes, a signal of an unreliable step or environment. See Handling dynamic content.
- Runs — passed vs. total runs in the window, with a pass/fail trend chart.
You can export the history as PDF or JSON from this section too.
When a test fails
- Open the failing step and read the failure detail — assertion failures show what text or element was expected.
- Jump to this step in video to see the page state at that moment.
- Check Console for JavaScript errors around that step.
- Compare browser tabs — a failure in only one browser points to a browser-specific bug.
- Cross-check the step's match confidence — a low-confidence match may mean the test needs updating, not your site. If the page changed on purpose, set the new look as the target instead of re-recording.
For recurring failure patterns, see Common errors. For the full reports list and filtering, see Reports.